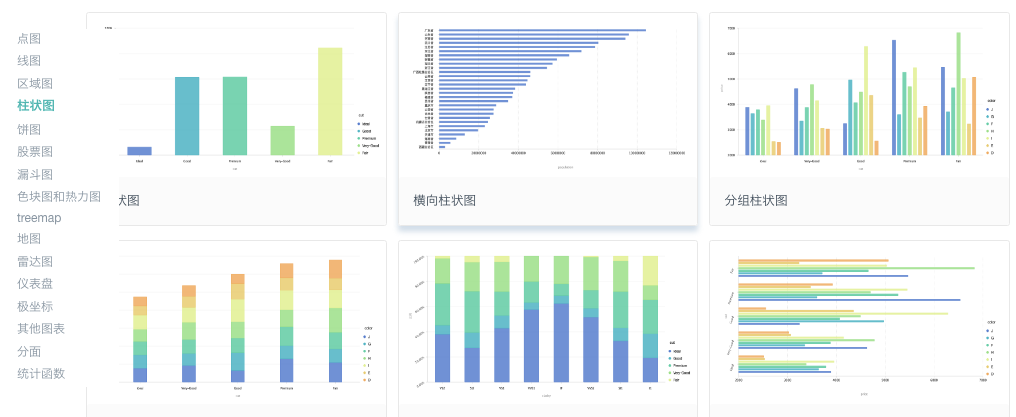
一、简介 G2 是阿里巴巴内部开放的数据可视化工具,提供丰富的图表类型,并且简单易上手,有比较完善的示例代码。其生成的图表简单漂亮,而且有JS互动显示,比较适合报告和文章插图。G2的数据来源是json格式数据。
G2绘制的图形
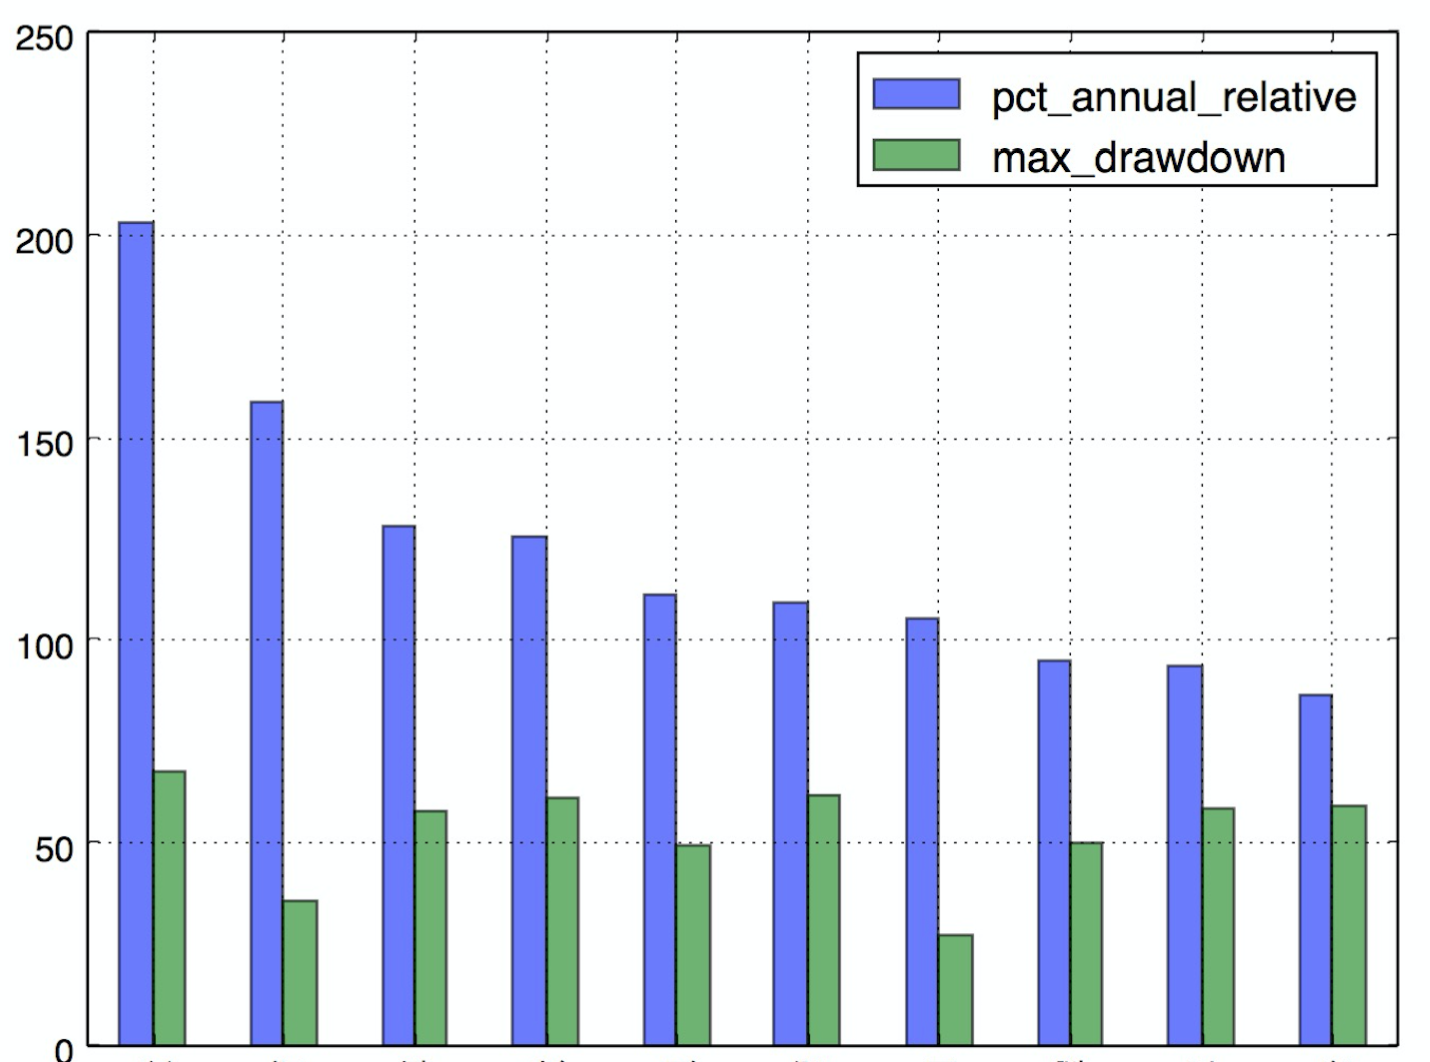
python的pandas库比较擅长对数据处理和分析,其DataFrame生成json也很方便。pandas自身集成了matplotlib的绘图功能,但是绘制的图形没有G2美观。
pandas 绘制的图形
二、pandas和G2结合绘图 绘制流程如下:
1,pandas读取mysql数据库
2,pandas对数据加工处理
3,pandas生成json数据
4,创建含G2内容的html,嵌入json数据
5,调整G2参数,并显示
下面以具体的案例来说明
1,计算收益率排名前十的专家 a,读取数据 1 2 3 4 5 6 7 from sqlalchemy import create_engine import pandas as pd sql = "select * from strategy order by pct desc" df = pd.read_sql(sql, engine) df['pct'] = df['pct'] * 100 #收益率转换为百分比
b,生成json数据 数据写到top10.json文件中
1 2 3 4 5 6 7 8 9 10 import json datas = [] for ix, row in df[:10].iterrows(): sss = {'name': row['name'], 'pct': float(row['pct'])} datas.append(sss) encodejson = json.dumps(datas, ensure_ascii=False) f = open('top10.json', 'w') f.write(encodejson) f.close()
c,创建html 从http://g2.alipay.com/demo/ 选取一个图表模板创建html文件, 这里选取的是双 Y 轴
1 2 3 4 5 6 7 8 9 10 11 12 13 14 15 16 17 18 19 20 21 22 23 24 25 26 27 28 29 30 31 32 33 34 35 36 37 38 39 40 41 42 43 44 45 46 47 48 49 50 51 52 53 54 55 56 57 *** top10.html *** <!DOCTYPE html> <html> <head> <meta charset="utf-8"> <title>收益率排名TOP10</title> <link rel="stylesheet" type="text/css" href="https://as.alipayobjects.com/g/datavis/g2-static/0.0.8/doc.css" /> <!--如果不需要jquery ajax 则可以不引入--> <script src="https://a.alipayobjects.com/jquery/jquery/1.11.1/jquery.js"></script> <script src="https://a.alipayobjects.com/alipay-request/3.0.3/index.js"></script> <!-- 引入 G2 脚本 --> <script src="https://as.alipayobjects.com/g/datavis/g2/1.2.2/index.js"></script> </head> <body> <div> </div> <div> </div> <div> </div> <div id="c1"></div> <!-- G2 code start --> <script> $.getJSON('top10.json', function (data) { var Frame = G2.Frame; var frame = new Frame(data); var chart = new G2.Chart({ id: 'c1', width: 500, height: 400 }); chart.source(frame, { 'pct': {alias: '年化相对收益率(%)'}, }); // 去除 X 轴标题 chart.axis('name', { title: null, labels:{ 'font-size':'6', 'font-weight': 'bold' //文本粗细 }, }); chart.legend(false);// 不显示图例 //chart.coord('rect').transpose(); chart.interval().position('name*pct').color('name'); // 绘制层叠柱状图 //chart.line().position('name*correct_rate').color('#5ed470').size(2).shape('smooth'); // 绘制曲线图 //chart.point().position('name*correct_rate').color('#5ed470'); // 绘制点图 chart.render(); }) </script> <!-- G2 code end --> </body> </html>
top10.html文件和top10.json文件在一个文件夹内。
2,计算推荐次数最多的股票 a,读取数据 1 2 3 4 5 from sqlalchemy import create_engine import pandas as pd sql = "SELECT code FROM stock " df = pd.read_sql(sql, engine)
b,数据处理 不同的分析师对一只股票可能有重复推荐,这就需要统计每只股票出现的次数,然后让总出现次数从高往低排序。
1 2 3 4 5 6 7 8 from nltk import FreqDist codes = df['code'].get_values() print "codes ", len(codes) fdist = FreqDist(codes) #生成词频类 fdf = pd.DataFrame(fdist.items(), columns=['code', 'count']) #转成DataFrame fdf.sort(columns='count', ascending=False, inplace=True) # 排序 print "fdf ", len(fdf)
c,生成表格 创建html跟一个案例比较相似,这里我们生成markdown格式的表格。
1 2 3 4 5 6 7 8 9 10 11 12 13 14 15 16 17 18 19 20 21 22 23 24 25 26 """ markdown 工具 """ def m_create_table(df): """ 从pandas的DataFrame生成markdown格式表格 :param df: :return: """ if len(df) == 0: return '' datas = [] head = '|'.join(df.columns) head = "|" + head + "|" datas.append(head) datas.append('-|-') for ix, row in df.iterrows(): data = '|'.join(map(lambda x: str(x), row.get_values())) data = "|" + data + "|" datas.append(data) result = '\n'.join(datas) # print result return result
调用并打印显示
1 2 3 4 5 6 7 8 9 10 11 12 13 14 15 16 17 makeTable = m_create_table(fdf) print makeTable #输出 |name|code| |-|-| |隆基股份|601012| |美的集团|000333| |贵州茅台|600519| |华策影视|300133| |国轩高科|002074| |网宿科技|300017| |阳光电源|300274| |沧州明珠|002108| |老板电器|002508| |保利地产|600048|
表格如下:
name
code
隆基股份
601012
美的集团
000333
贵州茅台
600519
华策影视
300133
国轩高科
002074
网宿科技
300017
阳光电源
300274
沧州明珠
002108
老板电器
002508
保利地产
600048
3,统计饼图 对于数据比较少的html,可以直接填入数据就能创建比较精美的图表了。
1 2 3 4 5 6 7 8 9 10 11 12 13 14 15 16 17 18 19 20 21 22 23 24 25 26 27 28 29 30 31 32 33 34 35 36 37 38 39 40 41 42 43 44 45 46 47 48 49 50 <!DOCTYPE html> <html> <head> <meta charset="utf-8"> <title>饼图</title> <link rel="stylesheet" type="text/css" href="https://as.alipayobjects.com/g/datavis/g2-static/0.0.12/doc.css" /> <!--如果不需要jquery ajax 则可以不引入--> <script src="https://a.alipayobjects.com/jquery/jquery/1.11.1/jquery.js"></script> <script src="https://a.alipayobjects.com/alipay-request/3.0.3/index.js"></script> <!-- 引入 G2 脚本 --><script src="https://as.alipayobjects.com/g/datavis/g2/1.2.6/index.js"></script> </head> <body> <div id="c1"></div> <!-- G2 code start --> <script> var data = [ {name: '买入', value: 17776 }, {name: '增持', value: 19890}, {name: '中性', value: 6814}, {name: '减持', value: 4986}, {name: '卖出', value: 494}, ]; var Stat = G2.Stat; var chart = new G2.Chart({ id: 'c1', width: 600, height: 400 }); chart.source(data); // 重要:绘制饼图时,必须声明 theta 坐标系 chart.coord('theta', { radius: 0.8 // 设置饼图的大小 }); chart.legend('bottom'); chart.intervalStack() .position(Stat.summary.percent('value')) .color('name') .label('name*..percent',function(name, percent){ percent = (percent * 100).toFixed(2) + '%'; return name + ' ' + percent; }); chart.render(); // 设置默认选中 var geom = chart.getGeoms()[0]; // 获取所有的图形 var items = geom.getData(); // 获取图形对应的数据 geom.setSelected(items[1]); // 设置选中 </script> <!-- G2 code end --> </body> </html>

